Key figures for the selected year.
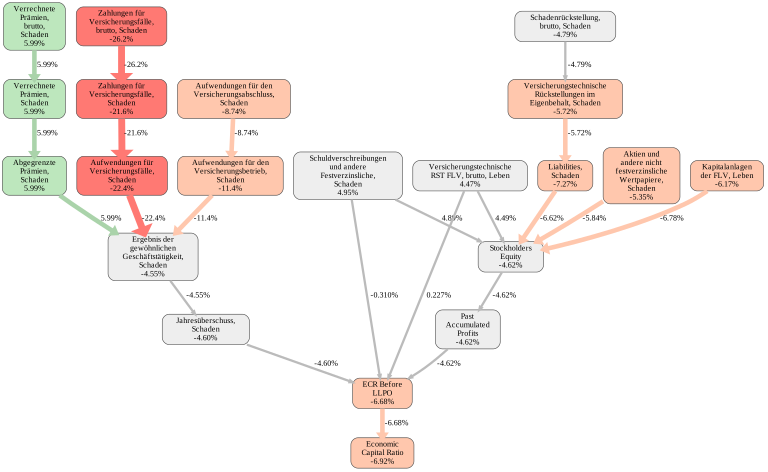
The model's causal graph for 2025. Inputs synthesize into the Economic Capital Ratio.
Impact on ECR in % points.
Absolute values from the public annual report, entered into the valuation model.
Absolute values calculated by the valuation model.
Charts generated by the RealRate valuation model for this report year.
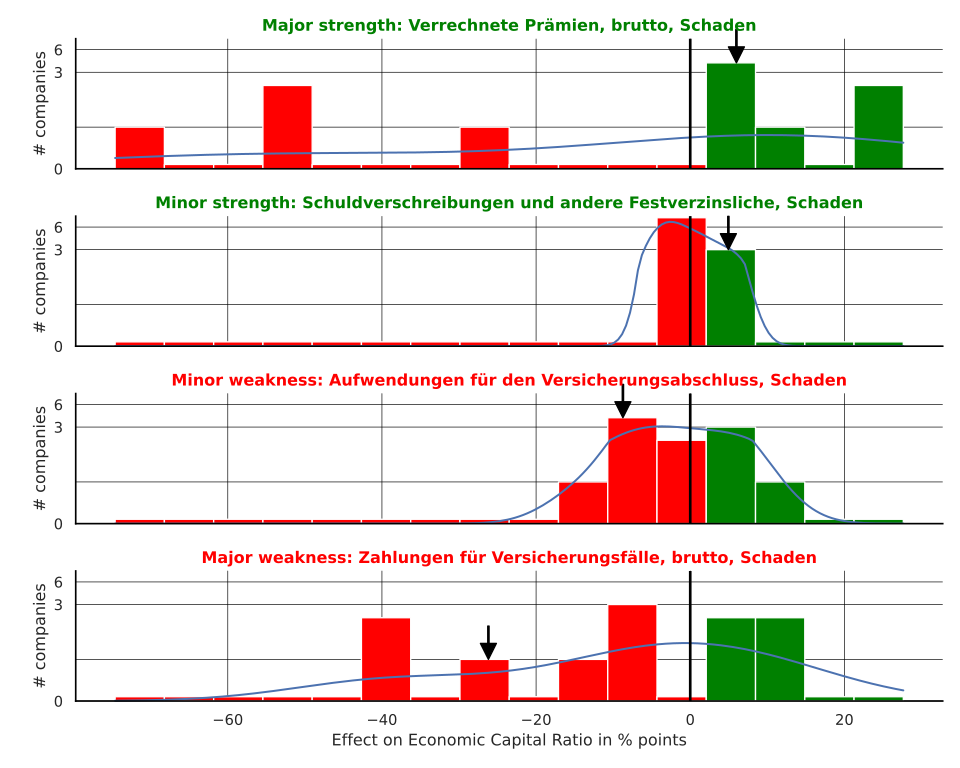
Distribution of each variable's impact on financial strength — green strengthens, red weakens.
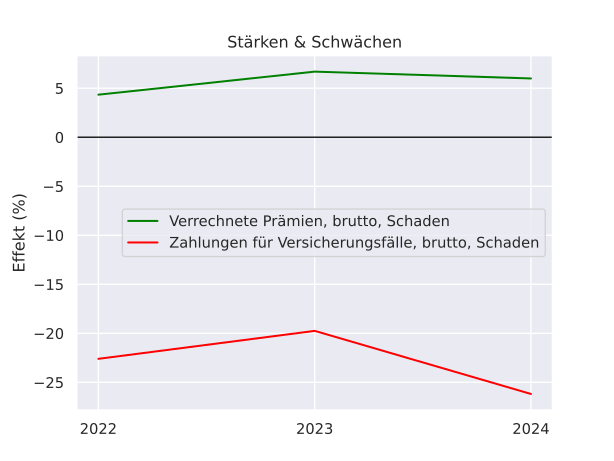
How the company's key drivers have shifted across years.
Model-forecast valuation vs. observed market value.