Sign in

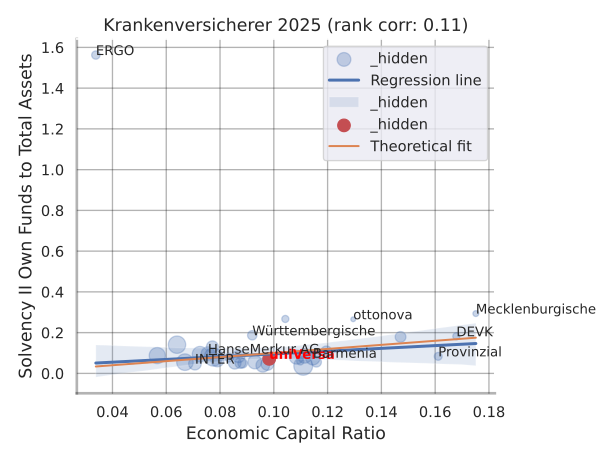
Key figures for the selected year.
The model's causal graph for 2026. Inputs synthesize into the Economic Capital Ratio.
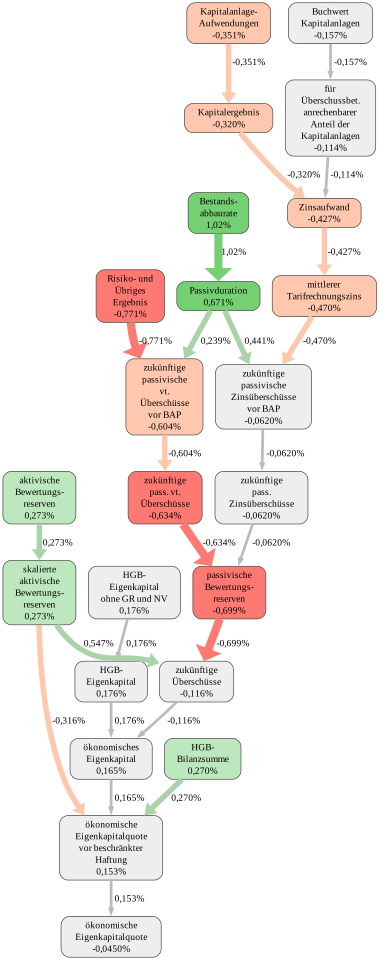
Impact on ECR in % points.
Absolute values from the public annual report, entered into the valuation model.
| Variable | × 1,000 EUR |
|---|---|
| Aufwendungen für Betrieb | 100,601 |
| Aufwendungen für Versicherungsfälle | 557,013 |
| Bestandsabbaurate | 2.6% |
| Buchwert Kapitalanlagen | 7,241,497 |
| Direktgutschrift | 23,533 |
| Genussrechte | 0 |
| Gewinnabführung | 0 |
| HGB- Alterungsrückstellung netto | 6,548,841 |
| HGB-Beitragsüberträge | 1,207 |
Effect on the ECR versus the market average, calculated by the valuation model.
| Variable | % points |
|---|---|
| HGB-Eigenkapital | 0.176 |
| ökonomisches Eigenkapital | 0.165 |
| HGB-Eigenkapital ohne GR und NV | 0.176 |
| Kapitalergebnis | -0.320 |
| Zinsaufwand | -0.427 |
| Kapitalanlage-Aufwendungen | -0.351 |
| Buchwert Kapitalanlagen | -0.157 |
| für Überschussbet. anrechenbarer Anteil der Kapitalanlagen | -0.114 |
| mittlerer Tarifrechnungszins | -0.470 |
| zukünftige passivische Zinsüberschüsse vor BAP | -0.0620 |
| Bestandsabbaurate | 1.02 |
| Passivduration | 0.671 |
| zukünftige passivische vt. Überschüsse vor BAP | -0.604 |
| zukünftige pass. Zinsüberschüsse | -0.0620 |
| zukünftige pass. vt. Überschüsse | -0.634 |
| Risiko- und Übriges Ergebnis | -0.771 |
| aktivische Bewertungsreserven | 0.273 |
| skalierte aktivische Bewertungsreserven | 0.273 |
| zukünftige Überschüsse | -0.116 |
| ökonomische Eigenkapitalquote vor beschränkter Haftung | 0.153 |
| passivische Bewertungsreserven | -0.699 |
| ökonomische Eigenkapitalquote | -0.0450 |
| HGB-Bilanzsumme | 0.270 |
Charts generated by the RealRate valuation model for this report year.
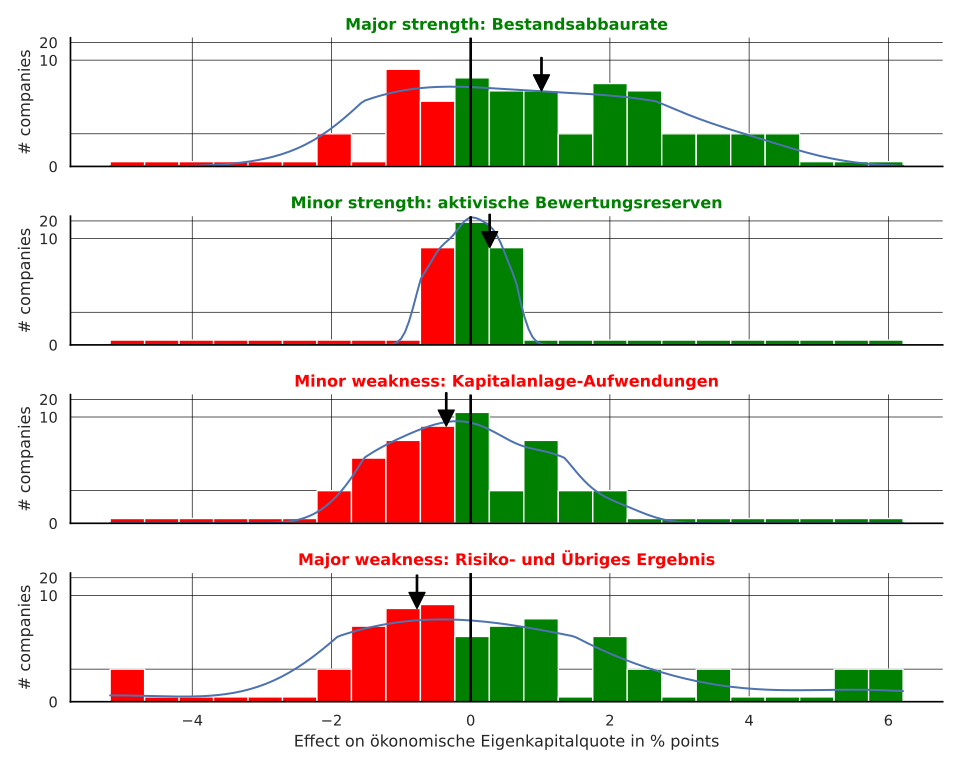
Distribution of each variable's impact on financial strength — green strengthens, red weakens.
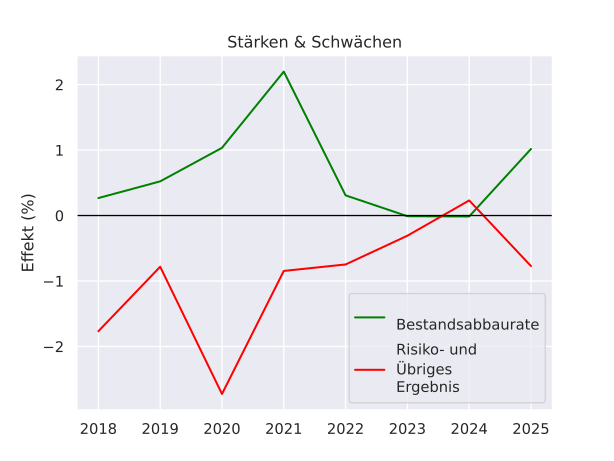
How the company's key drivers have shifted across years.
Model-forecast valuation vs. observed market value.