RealRate is very proud to announce that we have been mentioned in an article on private health insurance in versicherungsjournal.de.
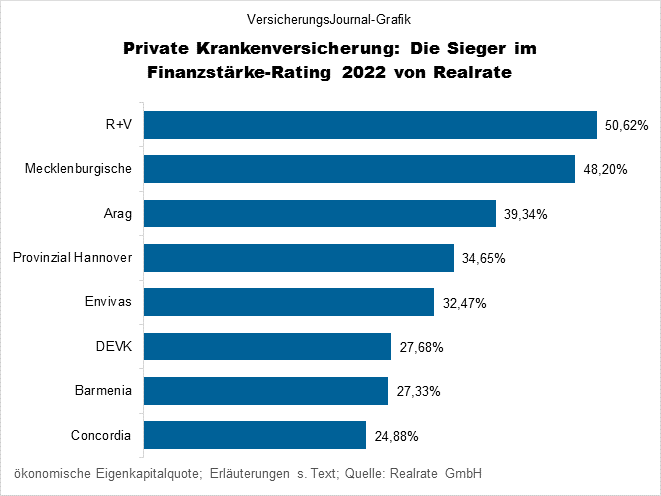
We examined a total of 33 market participants from private health insurance (PKV). The results of the 2022 German Private Health Insurance ratings show that R+V, Mecklenburgische and Arag have the highest economic equity ratios among private health insurers. The top 8 can be seen here. All 8 received our Top Rated award.
R+V: 50.62%
Mecklenburgische: 48.20%
Arag: 39.34%
Provinzial Hannover: 34.65%
Envivas: 32.47%
DEVK: 27.68%
Barmenia: 27.33%
Concordia: 24.88%
The economic equity ratio is the ratio of economic equity to the balance sheet total. “Economic equity includes, on the one hand, past profits that were saved in equity under commercial law, and, on the other hand, future profits from the portfolio,” explains Managing Director Holger Bartel when asked by the editors.
“A revaluation from book value to market value takes place; the hidden reserves resulting from the difference between book and market values are taken into account. The numerator of the economic equity ratio thus essentially corresponds methodologically to the numerator of the regulatory Solvency II ratio,” explains Bartel.
The analyst describes the selected evaluation model as “a hybrid system: On the one hand, it consists of an expert system. This gradually brings together the publicly available input data from the commercial law balance sheet via various key figures, up to the ultimately relevant economic equity ratio”.
In addition, artificial intelligence (AI) is used as a modern statistical method. This is done by robustly estimating key model parameters that determine the impact of equity and future profits on solvency across all companies and over several years.
According to Bartel, only a few free parameters are used. As an example, the Realrate managing director cites a “scaling factor for the commercial profits accumulated in the past, or for the present value multiplier, with which the future profits are multiplied in order to arrive at the company value”.
The full ranking can be viewed on this website. There, the analysts provide a two-page PDF rating report for each provider examined, which can be opened by clicking on the company name.
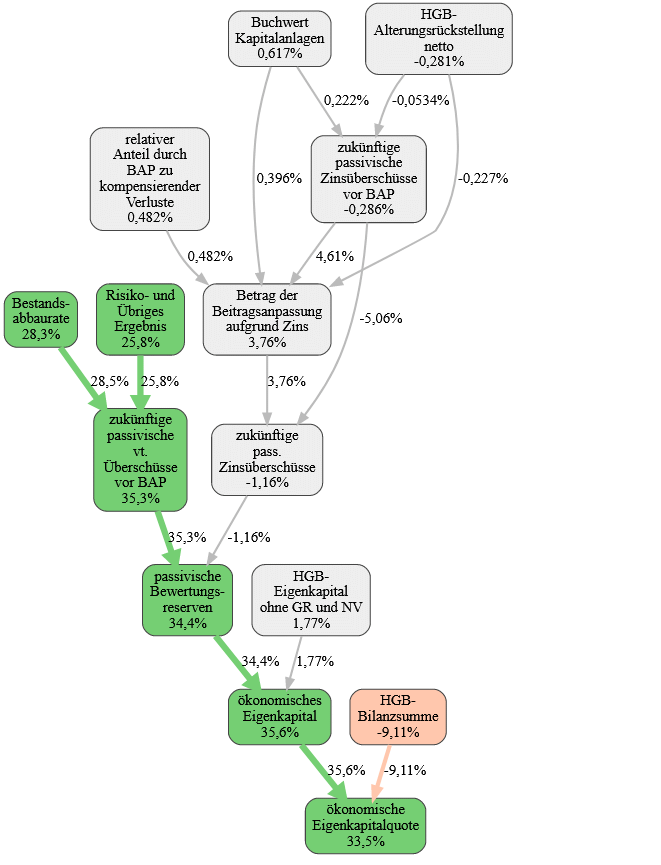
On the one hand, the document shows in tabular form how the respective company performs in relation to the variables that influence the economic equity ratio. The strengths and weaknesses compared to the market average are also mentioned.
On the other hand, in a causal graph, “the connection between the individual key figures is made clear. The strengths (green) and weaknesses (red) are highlighted in color,” explains Bartel.

Source: https://archive.realrate.ai/de_health/2021/report/DH4116_2022_R_V_Kranken.pdf
Main photo source: https://www.versicherungsjournal.de/markt-und-politik/diese-privaten-krankenversicherer-sind-besonders-finanzstark-146514.php?vc=newsletter&vk=146514

