Rank
10 of 45
Economic Capital Ratio
154.73%
Trend (+/- rank to previous year)
1.0
Summary
The relative strengths and weaknesses of KELLANOVA are analyzed with respect to the market average, including all of its competitors. We analyzed all variables having an effect on the Economic Capital Ratio.
The greatest strength of KELLANOVA compared to the market average is the variable Net Income, increasing the Economic Capital Ratio by 67% points.The greatest weakness of KELLANOVA is the variable Other Expenses, reducing the Economic Capital Ratio by 24% points.
The company’s Economic Capital Ratio, given in the ranking table, is 155%, being 149% points above the market average of 5.3%.
AI Causal Graph
The AI Causal Graph delineates the true determinants of financial strength. At the top of the graph, data from public annual reports is inputted. These variables are synthesized to ultimately produce the Economic Capital Ratio. Green nodes signify the company's strengths relative to the market average, enhancing financial robustness, whereas red nodes indicate weaknesses.

Causal Effects
The Causal Effects in each node indicate the individual impact of that variable on the final node, the Economic Capital Ratio. They reveal the extent to which the Economic Capital Ratio increases or decreases relative to the industry average. Cumulatively, these effects contribute to the overall Economic Capital Ratio.
| Name | Effect in % Points |
|---|---|
| Property and equipment | 4.34 |
| Assets | 22.2 |
| Liabilities | 79.2 |
| Stockholders Equity | 105 |
| Economic Capital Ratio | 149 |
| Assets, Current | -3.27 |
| Other Assets | -1.08 |
| Intangible Assets | 22.6 |
| Liabilities, Long Term | 48.4 |
| Liabilities, Current | -3.12 |
| Other Liabilities | 41.3 |
| Selling and Marketing Expense | 9.82 |
| Expenses | 4.10 |
| Revenues | 38.8 |
| Net Income | 67.3 |
| General and administrative Expense | 18.2 |
| Other Expenses | -23.9 |
| Other Revenues | 38.8 |
| Other Net Income | 24.4 |
| Comprehensive Net Income | 63.6 |
| Other Compr. Net Income | -3.65 |
Input Variables
The Input Variables consist of the absolute values from the public annual report data entered into the valuation model.
| Input Variables | in 1000 USD |
|---|---|
| Assets, Current | 3,330,000 |
| General and administrative Expense | 0 |
| Intangible Assets | 7,751,000 |
| Liabilities, Current | 5,060,000 |
| Liabilities, Long Term | 0 |
| Other Assets | 1,328,000 |
| Other Compr. Net Income | -323,000 |
| Other Expenses | 12,178,000 |
| Other Liabilities | 0 |
| Other Net Income | 7,000 |
| Other Revenues | 13,122,000 |
| Property and equipment | 3,212,000 |
| Selling and Marketing Expense | 0 |
Output Variables
The output variables are the absolute values as calculated by the valuation model.
| Output Variables | in 1000 USD |
|---|---|
| Assets | 15,621,000 |
| Liabilities | 5,060,000 |
| Expenses | 12,178,000 |
| Revenues | 13,122,000 |
| Stockholders Equity | 10,561,000 |
| Net Income | 951,000 |
| Comprehensive Net Income | 783,040 |
| Economic Capital Ratio | 155% |
Feature Distribution
The Feature Distribution illustrates the distribution of the model variables' effect values across the industry. The specific effect of the company in question within this distribution is indicated by a black arrow. The top two charts highlight the company's greatest strengths, whereas the bottom two charts reveal its most significant weaknesses.

Strengths and Weaknesses Over Time
The strengths and weaknesses plot shows how the company's greatest strengths and weaknesses develop over time. The corresponding impact measures the percentage point increase or decrease in the Economic Capital Ratio.

Keyfigures Over Time
The Key Figures over Time display tracks the development of assets and liabilities from the balance sheet, along with revenues and expenses from the profit and loss statement, over time.

Regression
The Regression compares the forecasted company valuation with the observed stock market values. A positive correlation suggests that the model effectively explains market prices. A company's valuation above the regression line indicates that the company is overvalued, otherwise it is undervalued.

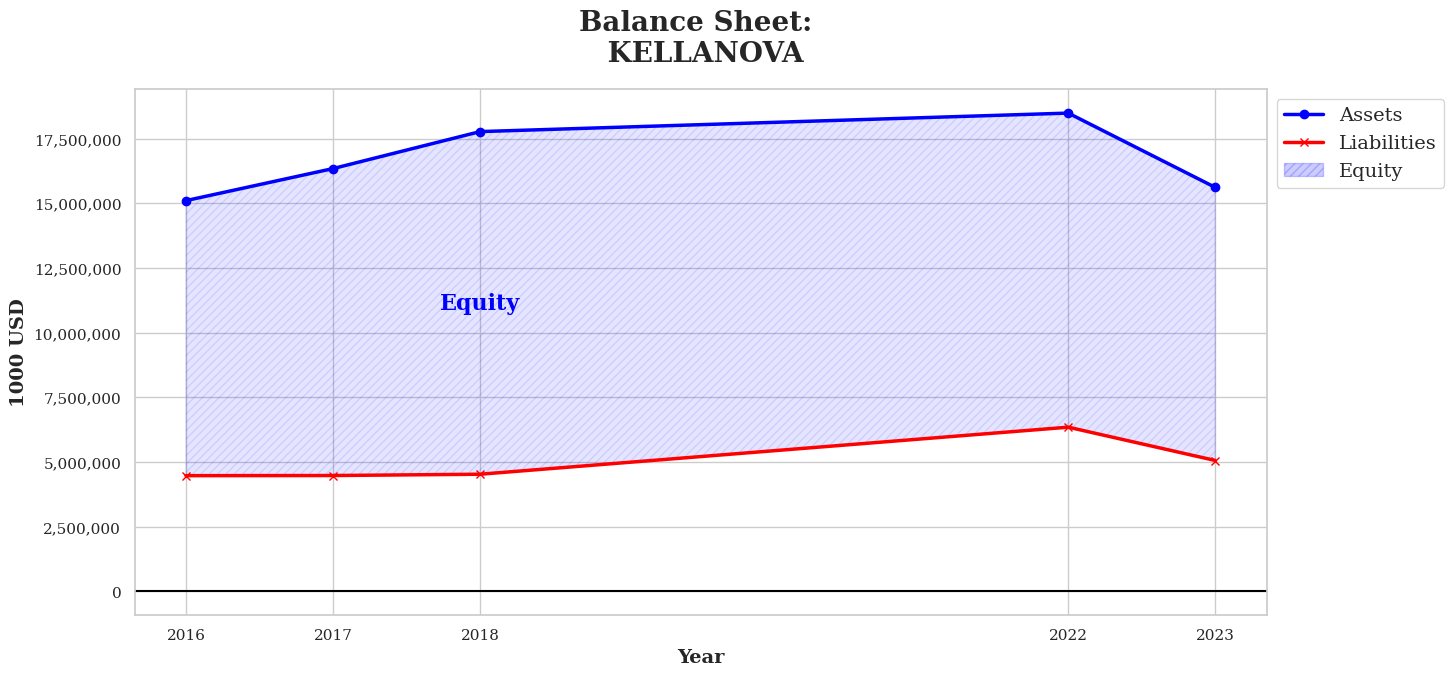
Balance Sheet
The Balance Sheet plot illustrates the evolution of Assets and Liabilities over time. The difference between them, known as Equity, represents the accumulation of past profits.
Profit & Loss
The Profit & Loss plot shows the development of Revenues and Expenses over time. The difference between these, either as Profit or Loss, reflects the surplus from the previous year.

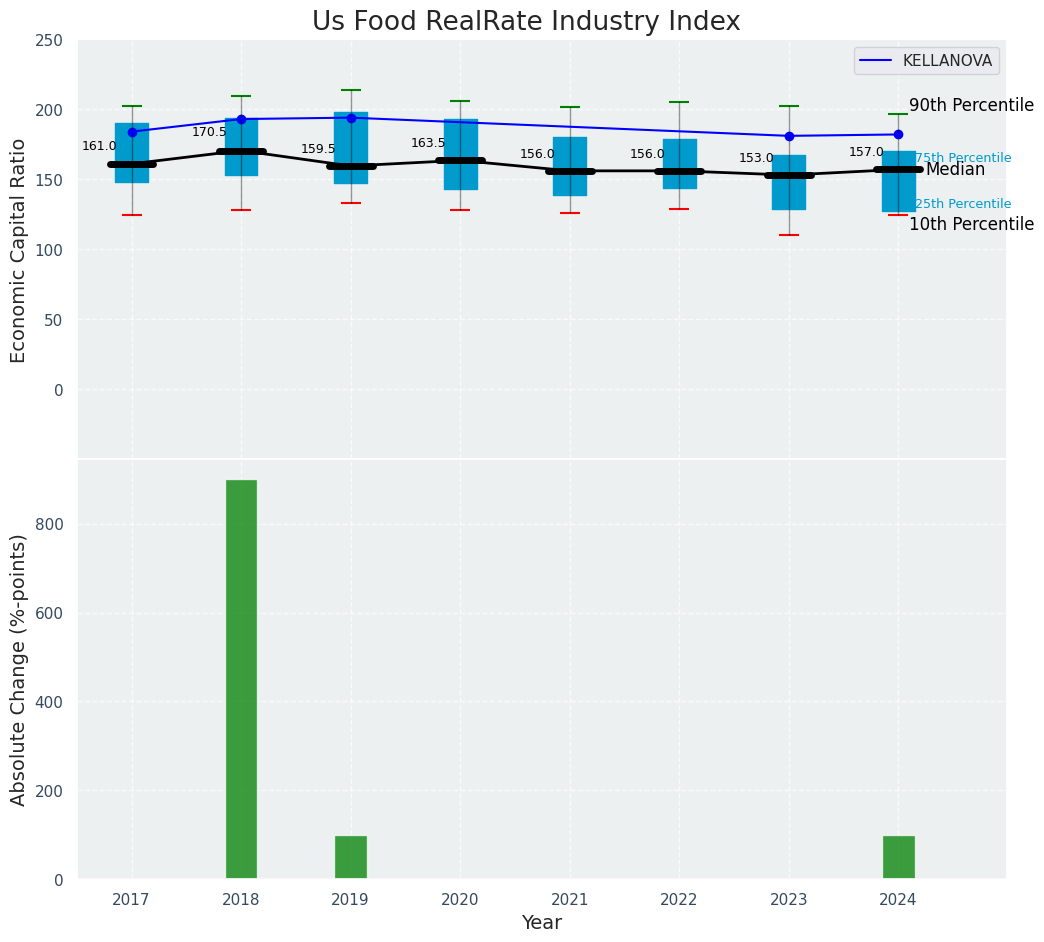
Industry Index
The RealRate Index shows how financial health develops over time. The blue line shows the evolution of the Economic Capital Ratio for the individual company. This is compared to the distribution of all other companies. The change in the company's financial strength is shown in the lower part.