The insurance business is complex — let’s make it explainable
(RealRate Inc.) contributed with their novel approach to fair and explainable company ratings. We showcased our most recent rating of all German life insurers.
Using graph techniques they succeeded in identifying and visually showing the strengths and weaknesses of the insurance companies. All the inputs and results are disclosed, providing maximum transparency. The graph-based approach ensures that the result will be explainable. AI will not be a black box anymore.
These are the top 10 of German life insurers:
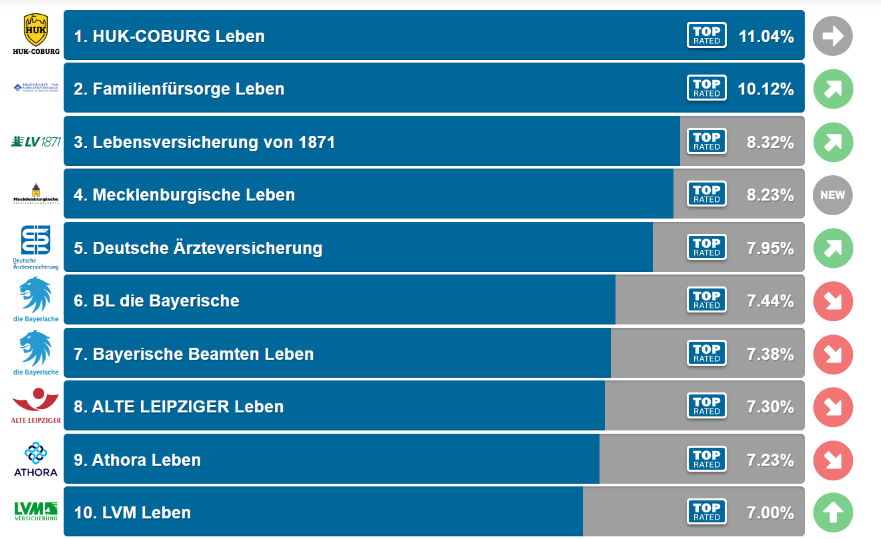
All AI ratings are publicly accessible via RealRate’s Ranking Area:
The hybrid AI approach
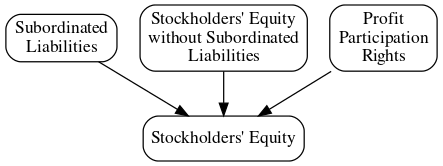
The core of RealRate’s AI is hybrid: Combining expert knowledge with classical artificial intelligence. E.g., inputting the equation stating that stockholders equity is composed of equity in the narrow sense plus subordinated loans and other profit participation rights results in this partial graph for stockholders’ equity:
Similarly, we have the partial graph for the market value of investments:
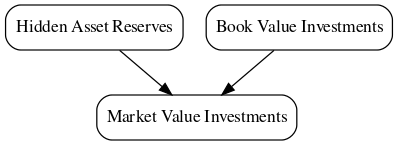
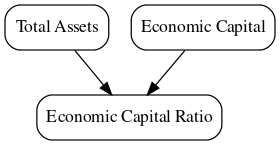
And so on. Variables are combined step by step until we get the variable we are finally interested in, the Economic Capital Ratio:
All this expert input results in a bigger graph. As you will see in the next section it already looks like a small neural network! And indeed, from here, classical AI takes over.
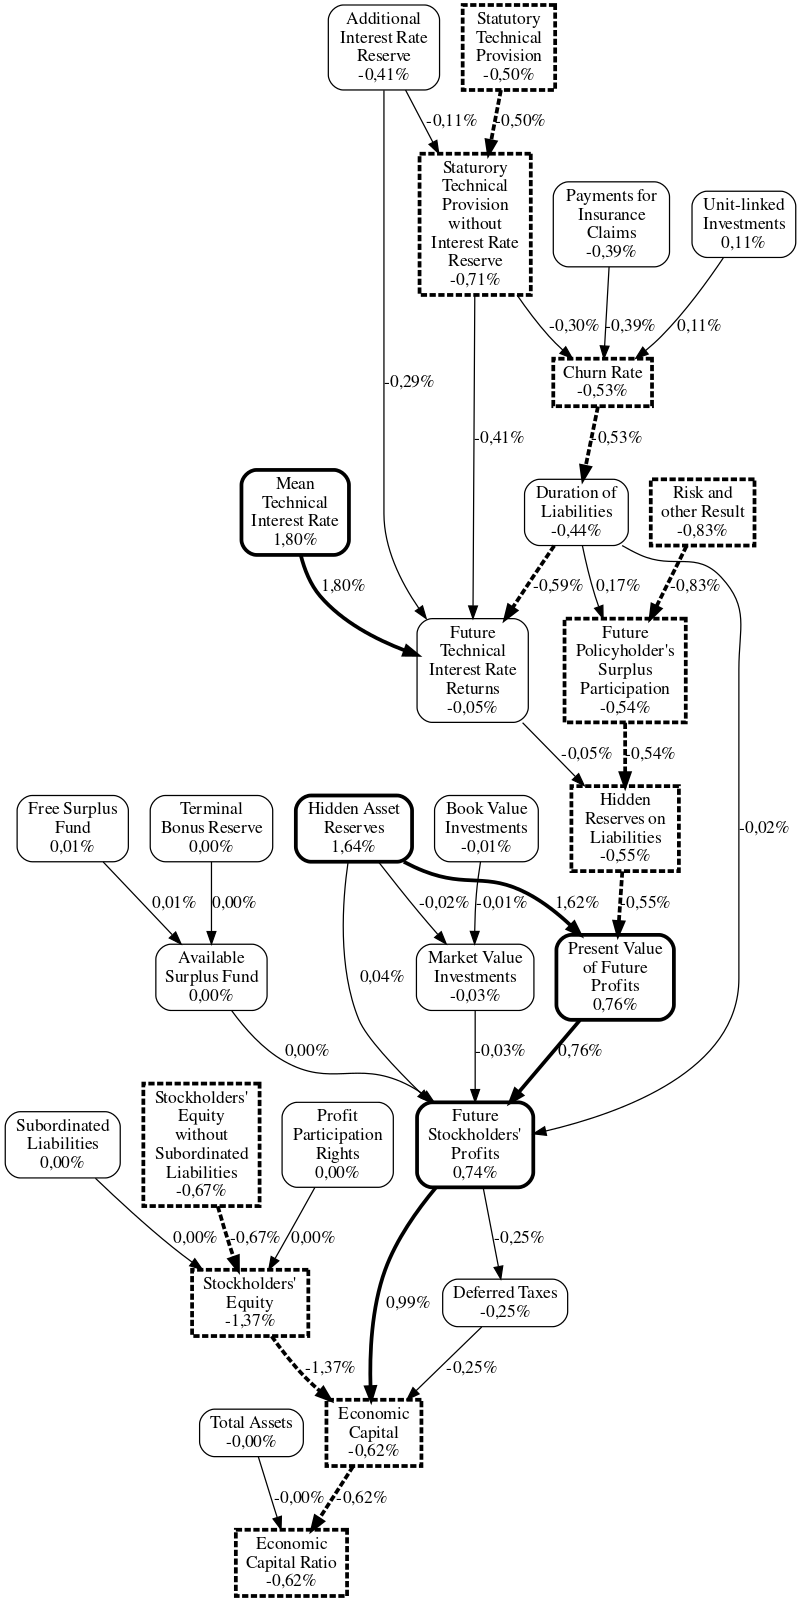
In total we get the causal graph, e.g. here for Allianz Life Insurance for the reporting Year 2020. The solid bold nodes are strengths of Allianz Life with respect to their competitors. For example, they have huge hidden reserves on the asset side of their balance sheet, increasing their Economic capital ratio by 1.64 percentage points as you can see from the respective node. The bold dashed nodes represent relative weaknesses.
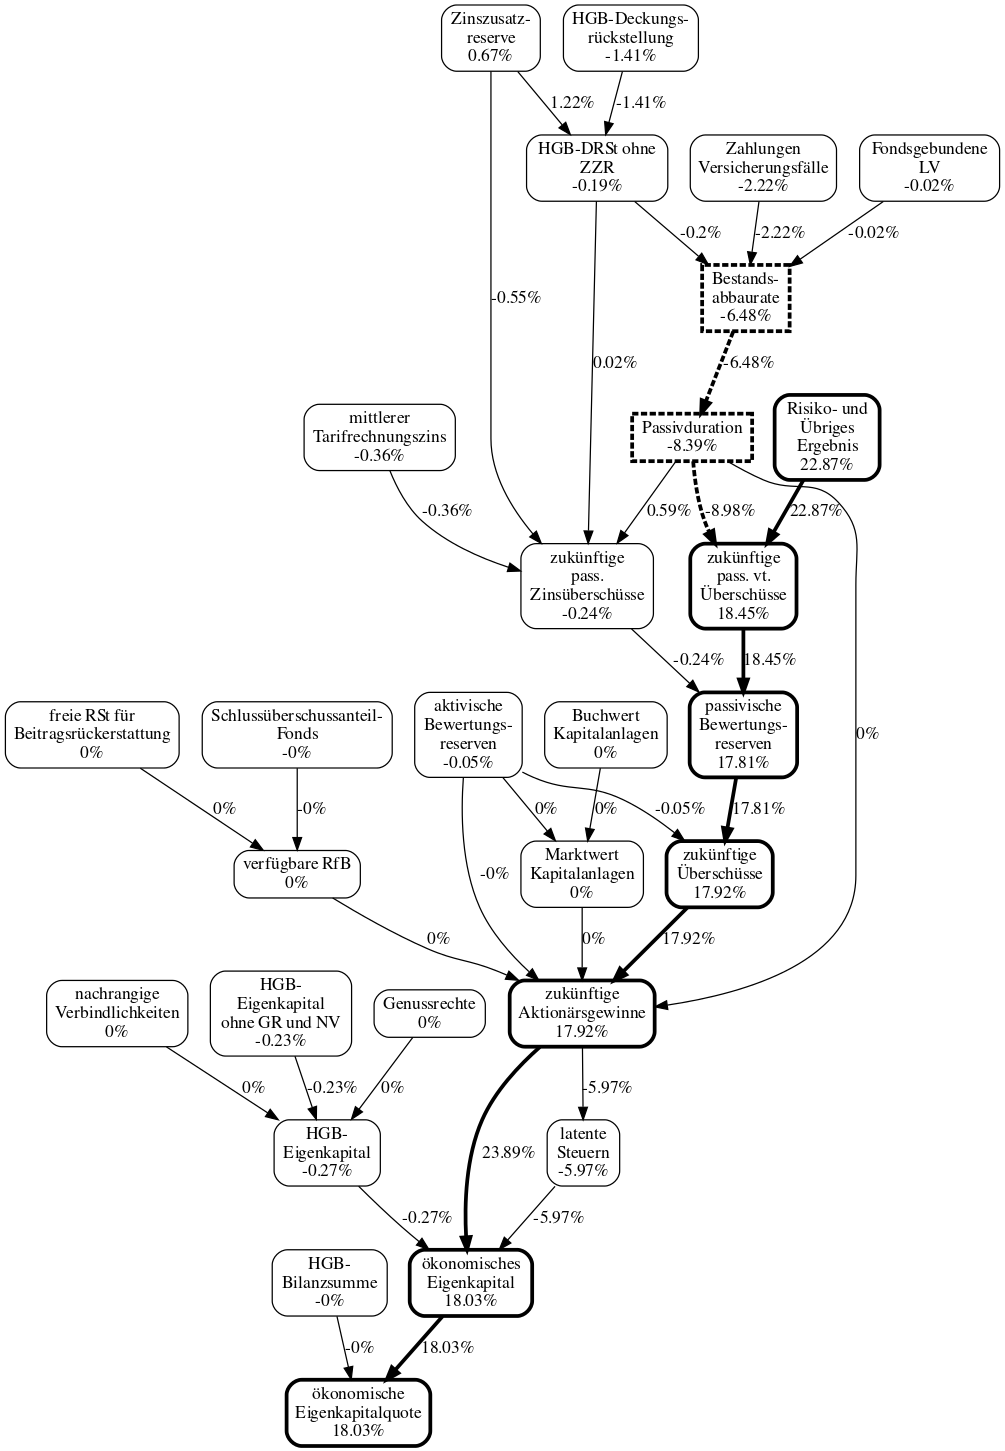
As you can see, you can grasp a company’s strengths and weaknesses simply from this graph. It should take you no more than two minutes — instead of having to read a 200-page annual report. Now let’s have a look at the insurers providing primarily term life insurance. The causal graph for German Dialog Life Insurance for the reporting year 2020 looks like this (with German node labels). Dialog has a very strong technical result, increasing its Economic Capital Ratio by 22.87 percentage points.
You might ask whether this AI-based rating is able to explain reality? Well, let’s have a look at the correlation between RealRate’s forecasted Economic Capital Ratio and the published Solvency II own funds ratio:
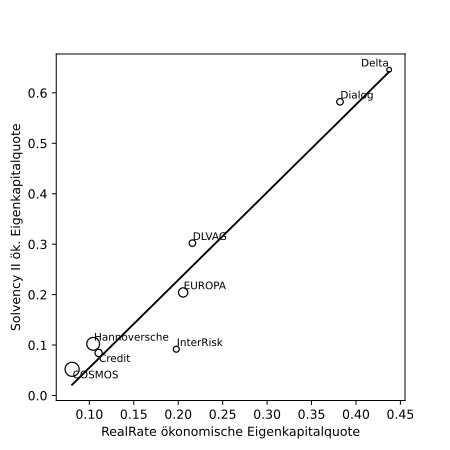
That’s really a fit. Learn more about our approach here: https://realrate.ai/methodology/
