
Financial crisis 2008
In 2008, the world was overwhelmed by an international financial crisis, triggered by the collapse of the US investment bank Lehman Brothers. This crisis had many different names: „financial crisis“, „mortgage crisis“, „debt crisis“, „subprime crisis“ and so on. But it was also a rating crisis: the major international rating agencies such as Standard & Poor’s, Moody’s and Fitch had given very good ratings for a long time and, after the collapse of the stock markets, had hesitated for a relatively long time to lower the ratings. This happened at a time when it was already too late for many investors.
Conflicts of interest
This rating crisis was also fueled by an inherent conflict of interest, as became particularly clear in retrospect: It is the rated companies themselves that commission a rating from the rating agencies. If the result is not good, no further ratings are commissioned. This is rather like a student paying his teacher to give him an independent grade. This is how the $10 billion global ratings industry works. Incidentally, the bad ratings then disappear into drawers and are never published.
Hybrid AI model
RealRate, based in Berlin and Santa Clara, is an international rating agency with a modern approach: we use artificial intelligence (AI) in combination with an expert system. This hybrid approach is used to analyze the financial strength of (insurance) companies. In contrast to the usual understanding of artificial intelligence, we do not work with Big Data but, on the contrary, quite deliberately with Small Data. The input data includes the balance sheet and income statement of the annual business reports. This already shows that the scope of the data is very limited. The annual report is only published once a year and only includes around one hundred relevant key figures. In comparison, there are hundreds of sensor data to be processed every second in self-driving cars, for example.
Explainable AI
The relatively limited amount of data forces one to impose a lot of structure on the model so that the parameters can be well estimated even with little data. This structure is our expert system, which links the input data in such a way that, after several calculation steps, the financial strength can be determined at the end. It is precisely this structure that makes the rating result explainable in the end. In this way, we hope to avoid the great weakness of artificial intelligence, namely the black box.
Causal graphs
Our approach falls into the area of so-called explainable artificial intelligence (XAI). The relationship between the metrics used is represented in a so-called causal graph. Each model equation is represented by a node into which the respective inputs flow. The darker the nodes, the greater the strength or weakness of the respective company compared to the market average. This enables the reader of the fully automated rating report to gradually trace the individual strengths and weaknesses of the company back to the causal input data.
With this innovative approach, RealRate won the international PyTorch AI Hackathon in 2020 in the Responsible AI category with more than 2500 participants. We have made our causal graph generation software publicly available under a free license (MIT license), see https://github.com/realrate/Causing. Here, the name „Causing“ stands for „Causal Interpretation using Graphs“.
Transparency
To ensure maximum transparency, extensive information is published. For example, all rating reports of all rated companies can be viewed online. These contain the input and output data used, as well as the causal graph in which the company’s greatest strengths and weaknesses are highlighted in color. In particular, the following rankings of German insurance companies were published in November 2022:
- Financial strength ranking of 60 German life insurers
(https://realrate.ai/ranking-area/2022-life-insurance/) - Financial strength ranking of 33 German private health insurers
https://realrate.ai/ranking-area/2022-health-insurance/ - Financial Strength Ranking 8 German Risk Life Insurers
https://realrate.ai/ranking-area/2022-risk-insurance/ - BU premium stability ranking of 59 German life insurers
https://realrate.ai/ranking-area/2022-disability-insurance/
The corresponding historical rankings of previous years, back to 2015, are available in the archive https://realrate.ai/ranking-area/.
Public data
RealRate uses only publicly available information as a data basis, i.e. in particular the balance sheet and the income statement, which are published annually in the annual report. In order to optimally determine the model parameters within the framework of so-called supervised learning, the solvency ratios of German insurers published in the SFCR (Solvency Financial Condition Report) are also used. All these data are not only publicly available but also audited.
We deliberately refrain from providing internal data and individual ratios, as well as interviews with management. Such information is subject to the individual selection of insurers and leads to a higher volatility of the rating results. The restriction to public data also has the major advantage that a benchmark analysis can be performed due to the comparability: Thus, the individual strengths and weaknesses of the individual insurer become clear in relation to the overall market.
Ranking of German life and health insurers
From a rating perspective, German life and health insurers are two of the most complicated industries of all. This is due to the very long-term insurance contracts, the high guaranteed interest rates and the asymmetry in the business model, which is also reflected in balance sheet items such as the RfB (provision for premium refunds) in connection with surplus participation. In the rating model, policyholder surplus participation is modeled using financial mathematical options, see also Bartel (2014).
What is striking compared to many other ratings is that this approach does not automatically find the large companies at the top. Instead, it shows that many smaller and medium-sized market participants have excellent financial stability. The relative balance sheet structure is the main focus here.
All insurers in a line of business are analyzed, based on annual reports for fiscal year 2021, but it is not meaningful to compare economic capital ratios across different lines of business, such as life and health insurers, because of the different business models. The first quarter of companies with the highest financial strength within a line of business therefore receives the RealRate Top Rated seal of approval.
Ranking of German life insurers in 2022
Once again, all German life insurers were rated according to their financial strength in 2022. These are the results for all 60 companies:
Economic
Place Name Economic Capital Ratio Top Rated
- HUK-COBURG 20,07 % Top Rated
- VRK 18,20 % Top Rated
- Bayerische Beamten 17,20 % Top Rated
- BL die Bayerische 15,38 % Top Rated
- Heidelberger 14,63 % Top Rated
- Athora 14,06 % Top Rated
- R + V VVaG 13,85 % Top Rated
- Mecklenburgische 13,74 % Top Rated
- Deutsche Ärzteversicherung 13,45 % Top Rated
- Continentale 13,34 % Top Rated
- HanseMerkur 12,77 % Top Rated
- Lebensversicherung von 1871 12,70 % Top Rated
- MÜNCHENER VEREIN 12,21 % Top Rated
- Victoria 12,01 % Top Rated
- VGH Provinzial Leben Hannover 11,86 % Top Rated
- Barmenia 11,83 %
- ALTE LEIPZIGER 11,63 %
- Ideal 11,58 %
- uniVersa 11,47 %
- LVM 11,25 %
- Öffentliche Leben Braunschweig 11,15 %
- Itzehoer 11,09 %
- Volkswohl-Bund 10,77 %
- INTER 10,46 %
- Öffentliche Leben Sachsen-Anhalt 10,34 %
- Provinzial Rheinland 10,25 %
- SV SparkassenVersicherung 9,84 %
- Öffentliche Leben Oldenburg 9,67 %
- Debeka 9,54 %
- DEVK Allgemeine 9,42 %
- Swiss Life 9,37 %
- SV Versicherung Sachsen 9,36 %
- AXA 9,01 %
- Gothaer 8,78 %
- Bayern-Versicherung 8,75 %
- HDI 8,42 %
- DEVK 8,38 %
- Allianz 8,23 %
- NÜRNBERGER 8,10 %
- R + V 7,34 %
- TARGO 7,33 %
- Württembergische 7,30 %
- Stuttgarter 7,21 %
- IDUNA 6,76 %
- Frankfurter 6,70 %
- ERGO 6,60 %
- Provinzial NordWest 6,46 %
- Generali 5,80 %
- Frankfurt Münchener 5,35 %
- Zurich Deutscher Herold 5,26 %
- PB 5,11 %
- Generali Deutschland 5,07 %
- HELVETIA 5,02 %
- Baloise 4,45 %
- Concordia oeco 3,66 %
- VPV AG 3,20 %
- Condor 2,46 %
- Skandia -2,97 %
- myLife -8,08 %
- WWK -11,15 %
With HUK-COBURG, VRK and Bayerische, it is precisely not the heavyweights of the market that find themselves in the top three places. And this result is also stable over time: these companies also achieved top rankings in previous years. The reasons for the good rankings are quite different.
Causal graph
As shown in the causal graph for HUK-COBURG Leben (see Figure 1), the high level of equity under commercial law (excluding profit participation rights and subordinated liabilities) is the main reason for the very good financial position. In 2016, HUK-COBURG Leben had received a comprehensive capital increase from the Group for the introduction of Solvency II. Compared with the market average, it increased the economic equity ratio by 7.63 percentage points. But the high product profitability (risk and other result) also contributes greatly to strengthening financial strength. It increases financial strength by 5.26 percentage points. Taking all effects into account, the economic equity ratio is 11.21 percentage points above the average for all German life insurers. The economic equity ratio, as shown in the ranking table, is 20.07%, around 11 percentage points above the market average of 8.9%.
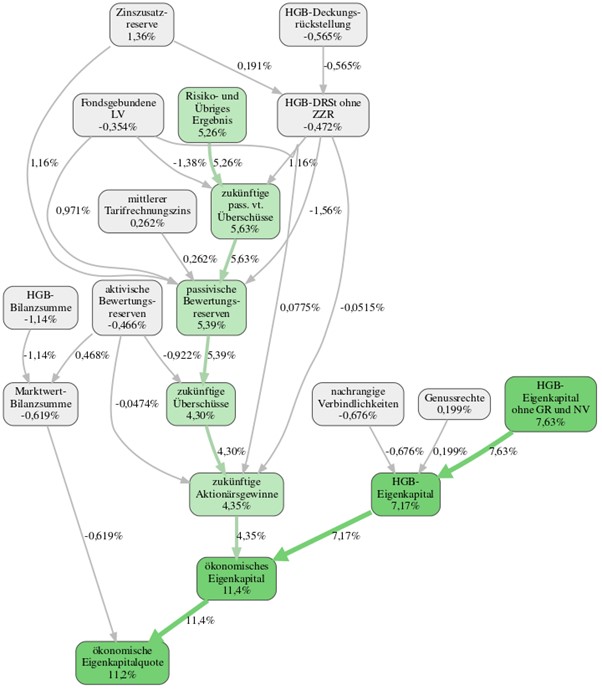
Figure 1: Causal graph of HUK-COBURG Leben (1st place).
As a further example, we look at VGH Provinzial Leben Hannover, which also receives the Top Rated seal in 15th place, see Figure 2. It benefits from its high active valuation reserves. This means that the market values of the investment are higher than the conservatively low book values. This increases the economic equity ratio by 1.54 percentage points compared with the benchmark for all life insurers. It should be noted that the RealRate Ranking 2022 refers to the balance sheet year 2021, that the annual reports are always published with a longer delay. Another strength is the low promised guaranteed interest rate (average tariff calculation interest rate), which is estimated indirectly from the available balance sheet data. Relative weaknesses, on the other hand, are the fact that the company has no subordinated liabilities and the relatively high proportion of traditional actuarial reserves. The economic equity ratio, as indicated in the ranking table, is 11.86% for VGH Hannover Life, which is around 3 percentage points higher than the market average of 8.9%.
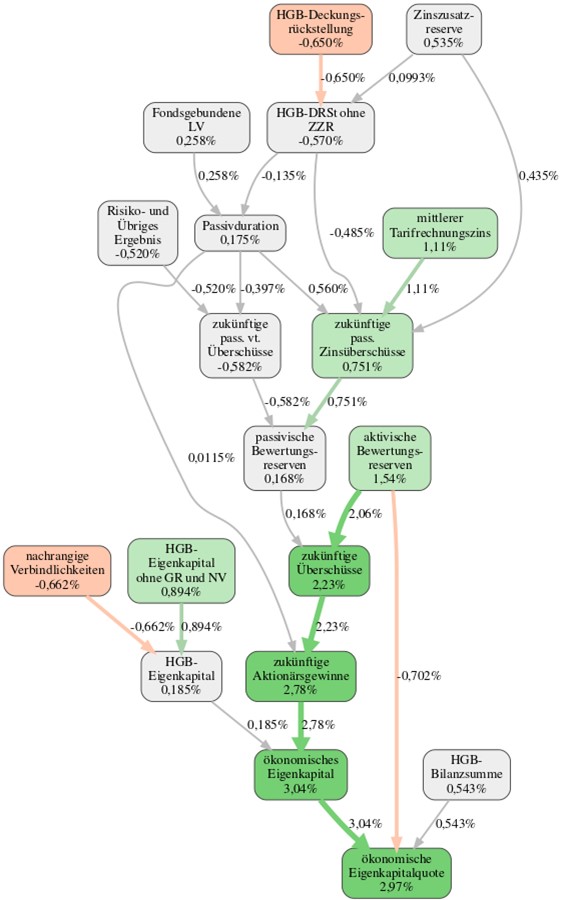
Figure 2: Causal graph of VGH Provinzial Leben Hannover (rank 15).
Thus, the strengths (and weaknesses) of each insurer can be interpreted within just two minutes – a time-consuming study of the annual report is no longer necessary. The explainable artificial intelligence highlights the main effects simply, clearly and individually.
Ranking of German health insurers in 2022
An analogous methodology was also used to evaluate the financially strongest German health insurers. The special features of the business model in health insurance were taken into account. In particular, the option to adjust premiums – in contrast to life insurance – was addressed. This option increases financial resilience: it is also provided for in the Solvency II supervisory regime. These are the results:
Economic
Place Name Economic Capital Ratio Top Rated
- R+V 50,62 % Top Rated
- Mecklenburgische 48,20 % Top Rated
- ARAG 39,34 % Top Rated
- Provinzial 34,65 % Top Rated
- ENVIVAS 32,47 %Top Rated
- DEVK 27,68 % Top Rated
- Barmenia 27,33 % Top Rated
- Concordia 24,88 % Top Rated
- HUK-COBURG 19,96 %
- Debeka 19,09 %
- Landeskrankenhilfe 19,04 %
- LVM 17,19 %
- uniVersa 17,04 %
- Versicherer im Raum der Kirchen 16,21 %
- Württembergische 14,67 %
- Bayerische Beamtenkrankenkasse 13,76 %
- Süddeutsche 13,55 %
- HanseMerkur 12,93 %
- ALTE OLDENBURGER 11,45 %
- ERGO 10,28 %
- HALLESCHE 10,01 %
- UNION 9,56 %
- Continentale 9,51 %
- INTER 9,29 %
- SIGNAL IDUNA 8,99 %
- MÜNCHENER VEREIN 7,96 %
- NÜRNBERGER 7,80 %
- Gothaer 7,26 %
- AXA 6,39 %
- Generali Deutschland 5,68 %
- DKV 4,77 %
- Allianz 4,69 %
- Freie Arzt- und Medizinkasse 4,23 %
The market leader Debeka narrowly failed to make it into the Top Rated ranking. The below-average underwriting profitability reduces the otherwise high valuation reserves on the liabilities side. The possible future premium adjustment due to the interest rate basis of calculation has a supporting effect. Adjusted for size, equity under commercial law is only slightly below average. Overall, Debeka’s financial strength is clearly above average: The economic equity ratio, as shown in the ranking table, is 19%, 1.9 percentage points above the market average of 17%.
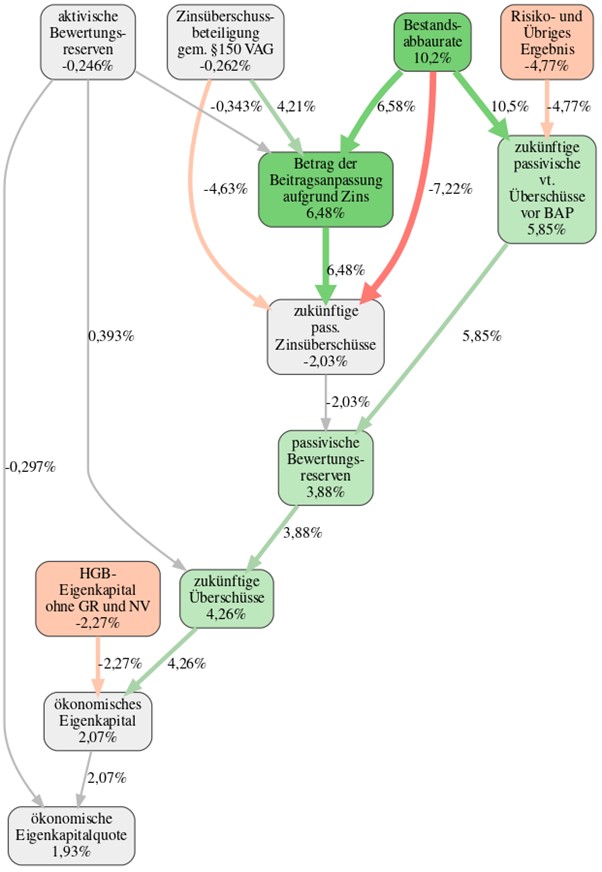
Figure 3: Causal graph of Debeka Kranken (rank 10)
Summary
When rating and analyzing German insurance balance sheets, it is important to avoid conflicts of interest, to work on objective data, to enable benchmark comparisons and to deal with assumptions and results in a transparent manner. In addition, the individual business model, such as guarantees, surplus participation or premium adjustments, must be taken into account in the assessment.
New hybrid approaches, such as the combination of expert systems and artificial intelligence, can help to gain new insights into the strengths and weaknesses of insurers. In this context, it is important to graphically illustrate the causal effect of complex systems. This novel approach was demonstrated using financial strength ratings for German life and health insurers.
Appendix
Bartel, H. (2014a). Simple Solvency – A Solvency Model for German Life Insurers. https://www.researchgate.net/publication/267337608_Simple_Solvency_-_Ein_Solvenzmodell_fur_deutsche_Lebensversicherer.
Bartel, H. (2014b). Simple Solvency – A Solvency Model for German Life Insurers, presentation, qx Club, Regional Group of the German Actuarial Association (DAV) for Berlin. https://www.researchgate.net/publication/267337670_Simple_Solvency_-ZEin_Solvenzmodell_fur_deutsche_Lebensversicherer.
Bartel, H. (2019). Causal analysis of systems of equations with structural neural networks. Technical report. https://www.researchgate.net/publication/335099531_Kausale_Analyse_von_Gleichungssystemen_mit_strukturellen_neuronalen_Netzen.
Bartel, H. (2020a). Causal Analysis – With an Application to Insurance Ratings https://www.researchgate.net/publication/339091133_Causal_Analysis_-_With_an_Application_to_Insurance_Ratings.
Bartel, H. (2020b). Explainable Artificial Intelligence (XAI) in Ratings. https://www.researchgate.net/publication/344992217_Explainable_Artificial_Intelligence_XAI_in_Ratings.
Bartel, H. (2020c). Causing CAUSal INterpretation using Graphs. https://www.researchgate.net/publication/341878489_Causing_CAUSal_INterpretation_using_Graphs.
Bartel, H. (2020d). RealRate Expert System Life Insurance. https://realrate.ai/download/publications/RealRate%20Expert%20System%20Life%20Insurance.pdf
Bartel, H. (2021a). Project Simple Solvency. https://www.researchgate.net/project/Simple-Solvency.
Bartel, H. (2021b). Project Causing. https://www.researchgate.net/project/Causing.
Originally published in „Zeitschrift für Versicherungswesen“:
